Introduction¶
NiftyPET is an open source software solution for standalone and high-throughput PET image reconstruction and analysis. The key computational routines are written in CUDA C for fast and efficient processing on NVIDIA GPU devices. The routines are then embedded in Python C extensions to be readily available for high level programming in Python *.
Aim¶
The purpose of this software platform is to enable rapid processing of raw data as wells as image data for fully controlled quantitative PET image reconstruction and analysis. NiftyPET includes two stand-alone and independent Python packages: nipet and nimpa, which are dedicated to high-throughput image reconstruction and analysis. Strong emphasis is put on the data, which are acquired using positron emission tomography (PET) and magnetic resonance (MR), especially the hybrid and simultaneous PET/MR scanners.
This documentation intends to present all the processing chains required not only for generating a final PET image from raw data acquired on a PET/MR scanner, but also further process the image to obtain a final statistic, such as global or regional SUV (standardised uptake value) or SUVr (SUV ratio).
The nipet (neuro-imaging PET) Python package contains all the routines needed for robust quantitative image reconstruction from raw data with added quality control of any processing segments, e.g., photon scatter or randoms corrections. The raw data typically includes large list-mode (LM) data (usually taking up GBs), data for detector normalisation, and data for attenuation correction, i.e., the attenuation map, also called the μ-map.
The nimpa (neuro-image manipulation, processing and analysis) package contains all the routines for image input/output, image trimming and up-sampling for regional signal extraction (e.g. from a region of interest–ROI), image registration, and importantly, for partial volume correction (PVC).
The key aspect of nipet is the fast LM processing for efficient uncertainty estimation of statistic based on image or projection data. Significant emphasis in placed on reconstruction for scanners with extended axial field of view (FOV), such as the latest PET/MR systems, e.g., the Siemens Biograph mMR or the GE Signa †.
The processing chains include:
list-mode data processing;
accurate attenuation coefficient map generation (with pseudo-CT for PET/MR);
detector normalisation with dead time correction;
exact forward and back projection between sinogram and image space;
estimation of reduced-variance random events;
high accuracy fully 3D estimation of scatter events;
voxel-based partial volume correction;
region- and voxel-level image analysis.
Due to its speed and additional functionalities, NiftyPET allows practical and efficient generation of multiple bootstrap realisations of raw and image datasets, being processed within arbitrarily complex reconstruction and analysis chains [1]. Based on these datasets, distributions of any statistic can be formed indicating the uncertainty of any given parameter of interest, for example, the regional SUVr in amyloid brain imaging.
Software infrastructure¶
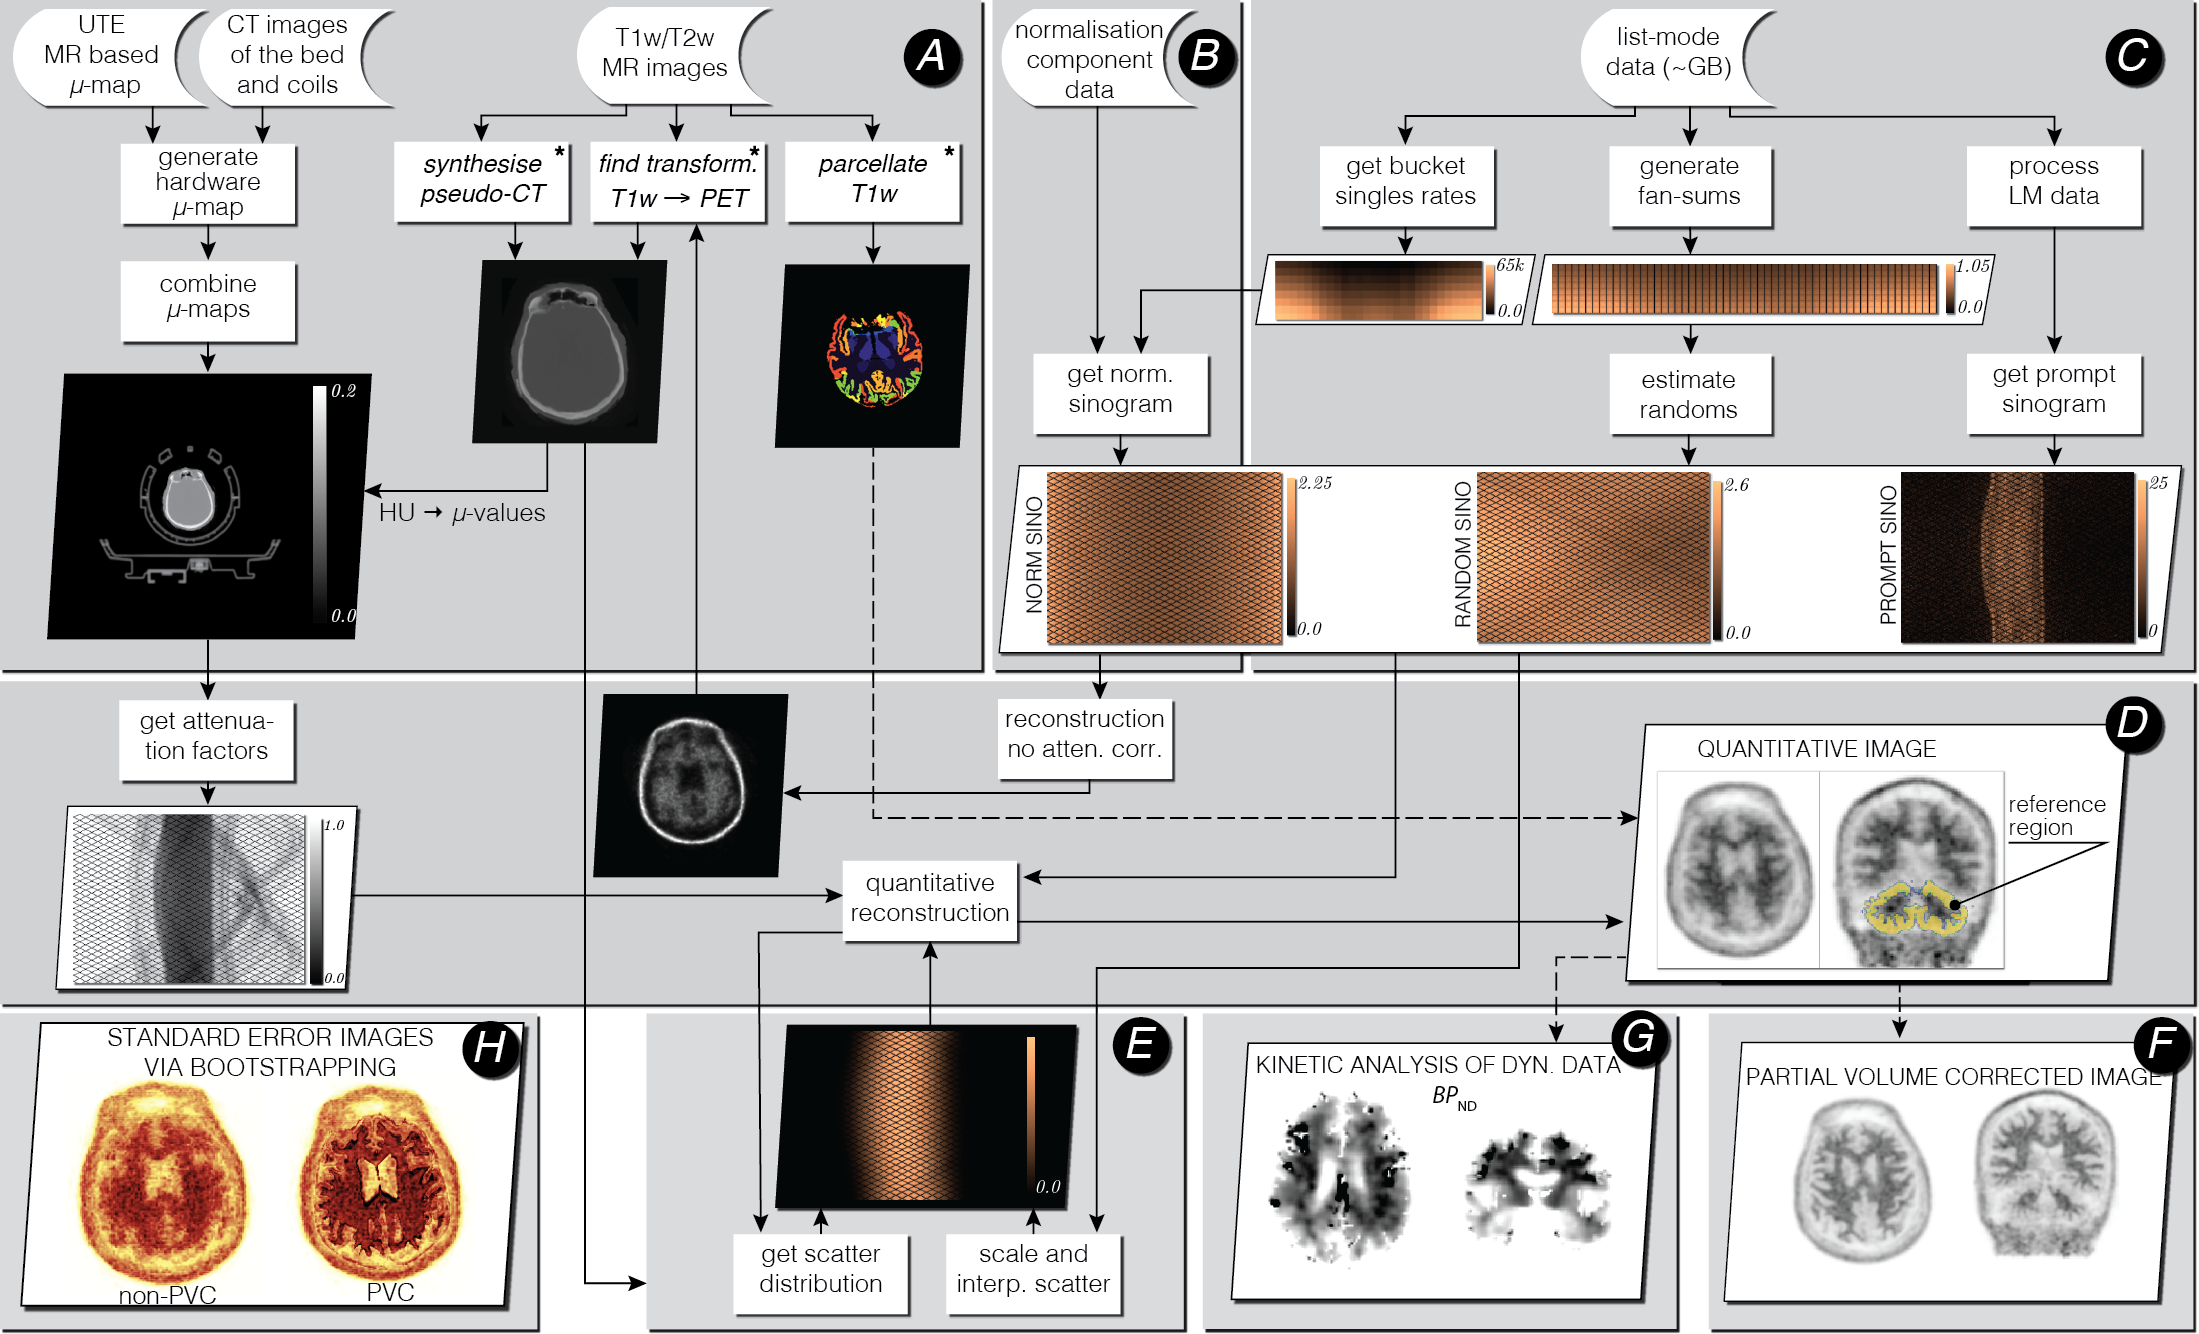
Fig. 1 Infrastructure for standalone PET image reconstruction and analysis of PET/MR brain data using amyloid PET tracer. The processing stages (A-H) are explained below. The asterisk (∗) indicates external software packages.¶
For demonstration purposes, all the processing stages presented in the above figure use an amyloid brain scan acquired on the Siemens Biograph mMR. The participant was taking part in “Insight 46”–a neuroscience sub-study of the Medical Research Council National Survey of Health and Development [2].
The input data include the attenuation coefficient maps (μ-maps) of the hardware and subject (stage A), normalisation component data (stage B) and the list-mode data (stage C). Optionally, T1 and/or T2 weighted MR images are provided for brain parcellation used in reconstruction and analysis stage D and partial volume correction (PVC) stage F. The T1w image is also used for generating an accurate subject’s μ-map.
In stage B the normalisation component data (relatively small file) is used to generate single factors for each sinogram bin, with the use of bucket singles obtained from list-mode (LM) processing in stage C. The LM processing stage C generates prompt and delayeds sinograms and fan sums, which are used for estimating reduced-variance randoms for each sinogram bin.
Great emphasis was put on the quantitative image reconstruction and analysis in stages D-H (for more details see [3]):
forward and back projectors used for image reconstruction (stage D); the attenuation factors are generated with the forward projector.
fully 3D estimation of scatter events (stage E), with high resolution ray tracing in image and projection space; the estimation is based on voxel-driven scatter model (VSM) and is coupled with image reconstruction, i.e., the scatter is updated every time a better image estimation of the radiotracer distribution is available.
voxel-wise partial volume correction using MRI brain parcellations (stage F), based on the iterative Yang method and given point spread function (PSF) of the whole imaging system (including the hardware and the reconstruction algorithm).
kinetic analysis using dynamic multi-frame PET data (stage G).
voxel-wise uncertainty estimation based on efficient generation of bootstrap LM data replicates (stage H).
Footnotes